Data Interpretation: Graphs and Tables
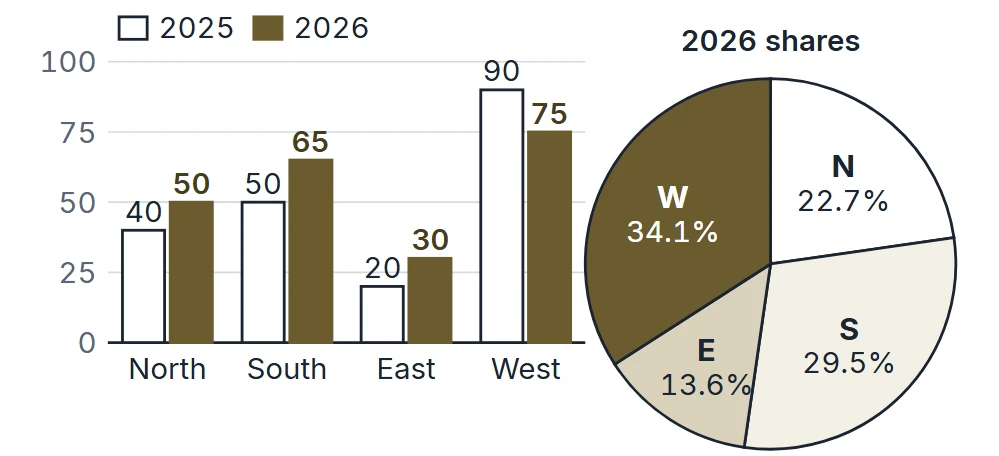
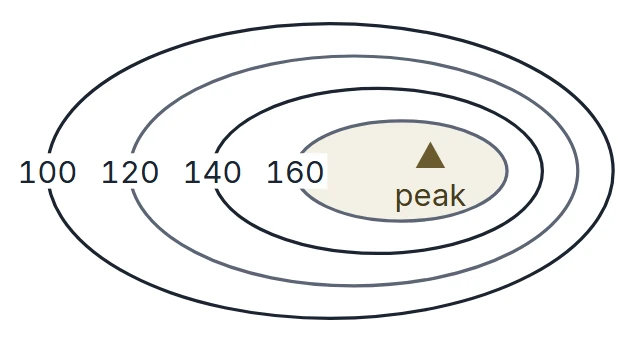
Method for data interpretation: units, scale and base before arithmetic; change versus share versus value; percent versus percentage points; pie-chart angles and why angles in two pies cannot be compared; line-graph slopes; tables with totals; 2-D plots (scatter, log scale); 3-D surface and contour plots with a worked contour reading; maps with scale and area scale; index numbers; growth rates (CAGR); and estimation by rounding and cross-multiplication. One original data set is shown as a bar chart and a pie chart and worked through.